Tracking KPIs quarter-on-quarter tells you whether you're improving. It doesn't tell you whether the number you're improving towards is actually good. And it doesn't tell you whether your measurement is giving you an accurate picture of your operation in the first place.
That last point is where the real performance gap comes from.
Two thirds of UK contact centres are now using or piloting AI, with 99% of those operations feeling confident in its impact. Yet across the metrics that matter most, performance has barely shifted year-on-year. FCR is flat or declining. Conversion rates are down. AHT is unchanged. Agent workloads are up 10%. The sector has invested heavily in technology but the performance gap remains as wide as ever.
The reason isn't that AI doesn't work. It's that most organisations use it in response to visible symptoms such as reducing call volume or speeding up response times, which leaves poor performance problems unaddressed at the root cause.
To understand where that gap sits, MaxContact surveyed 300 UK contact centre decision makers across sales, customer service and debt collection for our 2025-26 KPI Benchmarking Insights Report. It's the second year we've run the research, so we can track how performance is shifting over time.
The measurement problem nobody's talking about
Before we get to the performance benchmarks, let's draw your attention to the issue that runs through all of them.
Most contact centres measure performance through post-call surveys, manual QA sampling and periodic reporting. Post-call surveys capture a small sample of interactions, skewed toward customers at the extremes of satisfaction. Manual QA in organisations we speak to reaches max 5% of calls. Periodic reporting tells you what happened last month.
At that sample rate, you can identify which metric is underperforming but you can't reliably identify why. And if you can't identify why, you can't fix it. You're just guessing, which is what most performance optimisations actually are, dressed up as data-driven decision making.
This matters because every benchmark in this piece is only useful if your measurement is telling you the truth. A CSAT score built on 10% of calls, an FCR rate from manually sampled interactions, a conversion rate that looks reasonable against a sector average you've never questioned. These numbers can give you false confidence about performance you haven't really achieved.
If you want to review how your operation is capturing performance data, our complete guide to call centre reporting metrics covers the full picture. Keep that in mind as we work through each benchmark.
CSAT: the conditions matter more than the score
48% of contact centre leaders rank CSAT as a top 5 KPI
CSAT is the metric most contact centre leaders care about most. It's also the one where the gap between stated priority and operational reality is widest.
There's no single sector mean for CSAT in our data. Satisfaction scores vary too much by sector, use case and measurement method to produce a meaningful average. That variability is the first signal that something's wrong with how most operations approach it.
The more useful question isn't "what's a good CSAT score." It's "what conditions in your operation are producing the score you have." And on that measure, the benchmark data reveals a problem most operations aren't looking at directly.
Agent workloads increased at 53% of contact centres last year, a 10% rise on the year before. Annual agent turnover sits at 31.2% on average, with some operations reporting churn of 41-50%. These metrics are the direct mechanism through which CSAT deteriorates. Stretched agents handle calls differently, and high turnover means less experienced people managing more complex conversations. Neither produces the kind of consistent interactions that drive strong satisfaction scores.
Only 10% of contact centres in our survey reported annual churn below 20%. Those operations aren't just performing better on a staffing metric. They're building the kind of service consistency that CSAT is actually measuring. For most, high turnover is a structural drag on service quality that no post-call survey will fix. The survey measures the symptom. The cause goes unaddressed.
What good looks like also depends on your use case. In outbound sales, CSAT is partly a lead quality and script problem. Customers who feel mismatched to a product will score you poorly regardless of how the agent handled the call. In inbound customer service, resolution and wait time are the key drivers. The levers are different, so the benchmarks should be treated differently too.
The contact centres with the strongest CSAT scores aren't waiting for survey results to tell them something's wrong. They're using Conversation Analytics to understand sentiment across 100% of calls, spotting where calls are going wrong before it shows up in a survey score and before the customer has already decided not to come back.
Speed of answer: you're prioritising a metric you're not hitting
Sector mean: 17.4 seconds. High performer target: under 10 seconds
Speed of answer is the second most prioritised KPI in our survey, with 35% of respondents ranking it in their top five. The benchmark data reveals something uncomfortable about it.
Across all contact centres, the mean is 17.4 seconds. The high performer target is 10 seconds. Nearly 40% of respondents are already hitting between 2 and 10 seconds. That's the bracket that defines good. Therefore, most contact centres are actively prioritising a metric they're not hitting, against a standard they may not have explicitly set.
The difference between 17 seconds and 10 seconds may not sound critical. But for a customer who has already decided to pick up the phone, who has exhausted self-service and committed to the friction of a call, every additional second in a queue adds to existing frustration. Our data shows mean call abandonment sits at 4.1%. Operations answering in under 10 seconds are less exposed to that abandonment, and the customers they do lose are disproportionately the ones closest to walking away entirely.
Speed of answer is primarily an inbound metric. For outbound sales and debt collection, the equivalent is connect rate, the percentage of dialled numbers that reach a person. The sector mean is 42.8%, with high performers achieving 60-79%. If your operation is outbound-led, that's the speed benchmark driving your performance.
For inbound teams, closing the gap between 17 and 10 seconds comes down to workforce management and call deflection. Smarter IVR design, AI-assisted resolution of routine queries, and capacity planning that reflects actual demand patterns. Our report shows 38% of respondents are already using predictive analytics for capacity planning. Those operations hold speed of answer during demand spikes without the cost of permanent overstaffing.
Service level achievement: a baseline, not a definition of good
34% of contact centre leaders rank service level achievement as a top 5 KPI
Service level achievement sits third in our KPI rankings. It's also the metric where the definition of good is most taken for granted.
The standard most operations work to is the 80/20 rule: 80% of calls answered within 20 seconds. It's been around long enough to feel like a law of physics rather than a performance target. Most contact centres treat hitting it as the definition of good when it isn't. It's the definition of acceptable.
The operations genuinely performing well on service level aren't managing to 80/20. They're using it as a floor. The 39% of respondents answering calls within 2-10 seconds haven't set a different target. They've built operations that outperform the standard because their workforce management, demand forecasting and deflection are sophisticated enough to absorb volume spikes without queue times creeping up.
The biggest threat to service level is workload. Agent workloads increased at 53% of contact centres last year. When demand rises faster than capacity, service level is the first metric to suffer and the one customers feel most directly. You can have strong FCR and solid CSAT and still lose customers at the queue stage because they simply couldn't get through.
For outbound operations, service level works differently. It's less about queue management and more about campaign pacing, maintaining consistent contact rates without burning through call lists or hitting compliance thresholds. Good performance in any channel means holding your numbers when conditions get difficult, not just when demand is manageable.
The 38% of respondents using predictive analytics for capacity planning are better placed here than those still forecasting from historical averages. Demand patterns have shifted, and operations working from last year's data are likely to be caught short. Service level is where that shows up first.
80/20 is where you start. Consistently beating it is what good actually looks like.
Conversion rate: you're solving the wrong problem
Sector mean: 16%. High performer bracket: 20-29%. MaxContact platform average: 38.8%
Most contact centres trying to improve conversion rate start in the wrong place. They review scripts. They add coaching. They push agents to make more calls. The data suggests none of those things address the primary problem.
The sector mean conversion rate is 16%. Average daily calls per agent have fallen from 65.5 to 59 year-on-year. First-call close rates have dropped from 28% to 25%. That looks like a performance decline. But consumer confidence has fallen sharply over the same period. Agents aren't getting worse. They're working harder against a more resistant environment. Pushing them to make more calls doesn't close the gap. It increases attrition.
The operations holding conversion rates above 20% are doing it by being more precise about when they call, who they call, and which dialling mode they use for which campaign type. Most operations run one dialling mode across all campaign types and wonder why conversion is flat.
To show how wide that gap can be: across 7.8 million calls on the MaxContact platform, our customers achieve a 38.8% success rate against a sector mean of 16%. That difference doesn't come from better agents. It comes from smarter contact strategies. Predictive dialling for high-volume campaigns, preview dialling for high-value or sensitive conversations, and call timing built around when a specific customer is likely to answer.
For debt collection, the benchmarks shift but the underlying point holds. Promise to pay rate sits at a sector mean of 28%, and good is above 30%. Right party contact averages 27%. FCR in debt collection has dropped five percentage points to 37%, reflecting economic pressure on consumers rather than operational failure. But 15% of debt collection operations are still hitting collection rates of 40-49% in those same conditions. Reaching the right person at the right moment with an agent trained for a sensitive financial conversation produces a fundamentally different result than high-volume dialling and hoping for the best, and the operations hitting those numbers know it.
If your conversion rate is below the sector mean, the most useful question isn't "how do we improve our scripts." It's "are we contacting the right people, at the right time, in the right way" and do we have the data to answer that honestly.
FCR and AHT: the metric relationship that determines everything else
Inbound FCR mean: 40.9%. High performer bracket: 50-79%. Mean AHT: 7.8 minutes
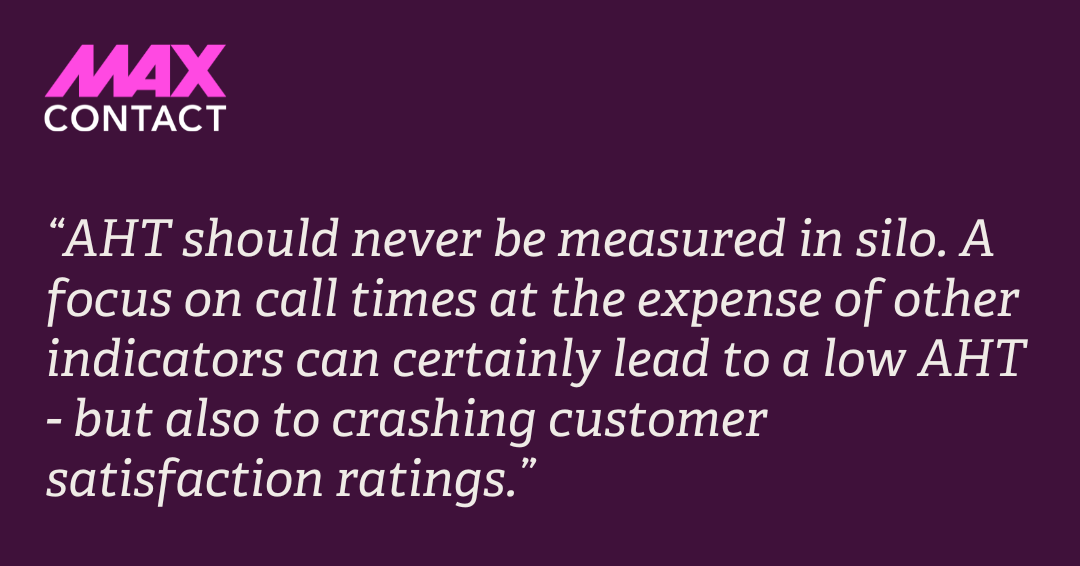
FCR and AHT are the two metrics most likely to be misread in isolation and most likely to be managed against each other in ways that make both worse.
The pattern is familiar. Leadership sees AHT creeping up and pushes agents to handle calls faster. AHT comes down. FCR comes down with it, because customers whose issues weren't properly resolved call back. Cost per contact rises. CSAT drops. The operation has optimised for a number and degraded its actual performance in the process.
The metric that looked like it was improving was masking a problem getting worse. This is why FCR and AHT need to be read together, always.
The inbound FCR mean is 40.9%. High performers, the top 27% of respondents, achieve 50-79%. That's the bracket to aim for. Mean inbound AHT is 7.8 minutes, with over a third of respondents reporting 10-15 minutes. That higher figure isn't a problem in isolation. A 12-minute call that resolves the issue completely is a better outcome for the customer, the agent and the cost base than a 5-minute call that generates a callback.
Good isn't a low AHT. It's a high FCR with an AHT that reflects the complexity of what your operation actually handles.
The use case split matters here. In inbound customer service, FCR above 50% is the high performer threshold. The operations hitting it aren't rushing calls. They're doing it through better agent knowledge, faster access to customer history, and calls that get to the point without losing the quality of the resolution. In debt collection, FCR has dropped five percentage points year-on-year to 37%, reflecting economic pressure on consumers. The 15% of debt collection operations achieving 40-49% FCR in those conditions are differentiating on contact precision and conversation quality, not volume. For outbound sales, the paired benchmarks that matter are calls to success ratio, with a mean of 15.6 calls per sale, and handle time, where 4-5 minutes is the sweet spot.
The performance gap on FCR is also where the measurement problem bites hardest. Most operations run manual QA on 2-5% of calls. At that sample rate, you can identify that FCR is low but you can't reliably identify why, which means you can't fix it systematically. Is it a knowledge gap? A script failure? A specific objection type agents aren't equipped to handle? A process breakdown adding unnecessary handle time without improving resolution? You can't answer those questions from 2-5% of your call data.
If AHT is the metric you're most focused on right now, our guide to reducing average handle time without sacrificing customer experience covers the specific tactics for closing that gap without pushing FCR in the wrong direction.
Why the performance gap isn't closing
Two-thirds of UK contact centres are using or piloting AI, and sentiment is overwhelmingly positive. So why haven't the numbers moved?
The answer is in where the investment is going. Chatbots and virtual agents are the most common AI applications in our survey, at 57% and 56% respectively. Both are built to stop calls reaching agents in the first place. That's a legitimate goal. But deflection doesn't tell you anything about the conversations that do get through. It can't explain why your FCR is sitting at 40% when high performers are hitting 60%. It won't surface the objection that keeps killing conversions at the same point in the call. It has no view on where resolution breaks down, or why.
The contact centres with the strongest metrics aren't necessarily running more AI tools. They're running them in a different place. Conversation Analytics applied across 100% of calls gives you a fundamentally different picture than manual QA on 2-5%. You can see patterns. You can identify what high-performing agents are doing differently. You can stop guessing at why a metric is underperforming and start knowing. Most contact centres already have the technology to do this. The question is whether it's being pointed at the right thing.
Where does your contact centre performance sit?
These benchmarks aren't a verdict. An FCR of 38% or a conversion rate below the sector mean doesn't mean your operation is in trouble, it means you now have a clearer sense of where the gap is and roughly how wide it is. Most operations never get that far.
The contact centres pulling ahead aren't doing anything the average operation couldn't. Agent stability is managed deliberately rather than accepted as an inevitability. Dialling strategy is matched to campaign type. FCR and AHT are read together. And critically, performance decisions are based on what's happening across the full call volume, not the fraction that manual QA and post-call surveys ever reach.
That last point is what makes underperformance so persistent. If your measurement is only capturing part of what's happening, you're optimising against an incomplete picture. The benchmarks in this report are only useful if the data behind your own metrics is sound.
For a broader look at efficiency measurement across your operation, our guide to measuring call centre efficiency is worth a read.
Want to go deeper on the data? The full 2025-26 UK Contact Centre KPI Benchmarking Insights Report covers all 300 respondents, segmented by use case, with year-on-year comparisons across every metric in this piece.
Download the 2025-26 UK Contact Centre KPI Benchmarking Insights Report





.png)
