We’ve compiled an easy-to-follow cheatsheet of metrics you should care about across four key areas to help you stay focused.
- Customer experience
- Agent productivity
- Call initiation
- Call centre operations
While tracking and acting on these metrics is a good place to start, they are only useful when they are measured in context.
Insights from our latest 2025-26 UK benchmarking report show that the highest-performing contact centres consistently outperform the average across multiple KPIs, reinforcing the importance of tracking the right metrics together rather than in isolation.
If you’re looking for a broader view of performance beyond individual KPIs, our guide on how to measure call centre efficiency explores how these metrics work together to drive overall effectiveness.
1. Customer experience metrics and KPIs
Metrics that measure customer satisfaction, loyalty and ease of service.
Customer Satisfaction Score (CSAT)
What is it? CSAT Measures customer satisfaction with a product, service, or interaction.
Why does it matter? It indicates overall customer happiness and loyalty.
Top tip: Use post-interaction surveys to gather feedback and address negative responses quickly.
How to calculate Customer Satisfaction Score (CSAT)
CSAT = (Positive Responses/Total Responses) x 100
CSAT is the most commonly prioritised KPI in UK contact centres. However, it’s crucial to note that it is most effective when it’s tracked alongside other metrics, such as first contact resolution and speed of answer.

Net Promoter Score (NPS)
What is it? NPS measures customer loyalty by asking customers, ‘How likely are you to recommend us?’
Why does it matter? NPS strongly correlates with long-term customer retention.
Top tip: Use follow-up questions to understand the pain points of detractors and convert them into promoters.
How to calculate Net Promoter Score (NPS)
NPS = %Promoters − %Detractors
First Contact Resolution (FCR)
What is it? First Contact Resolution (FCR) is the percentage of issues resolved during the first interaction with a call agent.
Why does it matter? Higher FCR usually has a positive impact on customer satisfaction and reduces repeat calls, resulting in less frustration.
How to calculate First Contact Resolution (FCR)
FCR = (Issues Resolved on First Contact/Total Issues)×100
UK contact centres report an average inbound FCR of around 41%, while over a quarter achieve rates above 50%. This highlights that there is usually a significant performance gap between average and top-performing teams.
First Response Time (FRT)
What is it? First Response Time (FRT) is the average time it takes to respond to a customer’s initial contact.
Why does it matter? The faster your responses, the higher your customer satisfaction scores will be.
How to calculate First Response Time (FRT)
FRT = Total Number of Tickets Responded To/Total Time to First Response for All Tickets
Customer Effort Score (CES)
What is it? Customer Effort Score (CES) measures how much effort it takes a customer to resolve their issue.
Why does it matter? The less effort a customer has to put in, the higher the correlation between satisfaction and loyalty.
How to calculate Customer Effort Score (CES)
CES=Total Number of Responses/ Sum of All Customer Effort Scores
Repeat Call Rate
What is it? Repeat Call Rate is the percentage of customers who call back about unresolved issues.
Why does it matter? A high Repeat Call Rate indicates gaps in problem resolution that could be addressed with agent training.
How to calculate Repeat Call Rate (RCR)
RCR=Total Calls Handled/Number of Repeat Calls×100
Script Adherence Rate
What is it? Script Adherence Rate is the percentage of calls where call agents have followed the approved script.
Why does it matter? It makes sure communication is consistent and regulatory compliant.
How to calculate Script Adherence Rate
Script Adherence Rate (%)= Total Number of Calls Evaluated/Number of Calls Where the Script Was Followed×100
Customer Lifetime Value (CLTV)
What is it? CLTV is the overall revenue a customer is expected to generate during their relationship with the business.
Why does it matter? It helps to prioritise high-value customer interactions and enables more experienced agents to handle those calls.
How to calculate Customer Lifetime Value (CLTV)
CLTV=Average Purchase Value×Average Purchase Frequency×Customer Lifespan
Revenue Per Call (RPC)
What is it? RPC measures revenue generated per call.
Why does it matter? RPC assesses the profitability of call centre operations.
How to calculate Revenue Per Call (RPC)
RPC=Total Number of Calls Handled/Total Revenue Generated
For outbound-focused teams, using metrics like RPC effectively depends on how well data is captured, analysed and subsequently acted on. This is a topic we explore further in 'Is your outbound sales team truly data driven?’
2. Agent productivity metrics
Metrics that provide insight into the performance of call centre teams and individual agents, highlighting strengths and areas for improvement through training.
-Average Handle Time (AHT)
What is it? AHT measures the total time spent on a call and includes talk, hold and wrap-up time.
Why does it matter? AHT can help identify if agents are effectively balancing efficiency and customer satisfaction.
How to calculate Average Handle Time (AHT)
AHT = Talk Time + Hold Time + After-Call Work/Total Calls Handled
Average handle time will always vary depending on call type. UK contact centres report that outbound calls average just over 8 minutes, with inbound support calls tracking slightly under that.
Average Talk Time (ATT)
What is it? ATT tracks the time agents spend actively speaking with customers.
Why does it matter? It indicates efficiency and the complexity of customer issues while providing more context to Average Handle Time.
How to calculate Average Talk Time (ATT)
ATT=Total Number of Calls Handled/Total Talk Time
Quality Assurance (QA) Score
What is it? Quality Assurance Score measures how well a call agent meets the defined quality of service, comparing an agent’s interaction against predefined scorecards.
Why does it matter? Monitoring QA ensures consistency and alignment with industry standards. Analysing quality scores across call agents can identify training needs.
How to calculate Quality Assurance Score (QA)
QA Score (%)=Total Points Available/Total Points Achieved×100
Agent Utilisation Rate
What is it? Agent Utilisation Rate calculates the percentage of an agent’s working time spent handling calls.
Why does it matter? It provides an overview of workload across call teams to prevent burnout.
How to calculate Agent Utilisation Rate
Agent Utilisation Rate (%)=Total Working Time/Time Spent on Productive Activities×100
Agent Utilisation Rate is becoming increasingly important for contact centres, with over half reporting that agent workloads have increased. This puts significant pressure on productivity and wellbeing.
Schedule Adherence Rate
What is it? Schedule Adherence Rate measures how closely agents stick to their schedules.
Why does it matter? It helps to make sure there is sufficient call agent coverage during peak times.
How to calculate Schedule Adherence Rate
Schedule Adherence Rate (%)=Total Scheduled Time/Time Spent Adhering to Schedule×100
Average Hold Time (AHT)
What is it? Average Hold Time measures the mean amount of time customers are placed on hold.
Why does it matter? Long average hold times highlight potential issues that need to be resolved, as they negatively impact customer satisfaction.
How to calculate Average Hold Time (AHT)
Average Hold Time (AHT)=Total Number of Calls/Total Hold Time Across All Calls
First-Call Close Rate
What is it? First-Call Close Rate shows the percentage of calls resolved on the first attempt.
Why does it matter? A high first-call close rate enhances customer satisfaction while reducing follow-up calls and agent workload.
How to calculate First-Call Close Rate (FCCR)
FCCR (%)=Total Number of Calls Handled/Number of Calls Closed on First Attempt×100
3. Call initiation metrics
Metrics that show how quickly and efficiently customer and agent calls are connected.
Average Speed of Answer (ASA)
What is it? ASA is the average time it takes for call agents to answer inbound calls.
Why does it matter? Longer wait times lead to frustrated customers and higher call abandonment.
How to calculate Average Speed of Answer (ASA)
ASA = Total Time Waiting in Queue/Total Calls Answered
The UK average speed of answer sits at around 17 seconds. However, many contact centres consistently answer calls within 10 seconds, which shows what’s actually achievable with effective resourcing.
Call Transfer Rate
What is it? Call transfer rate measures the percentage of calls transferred to another agent or department.
Why does it matter? High call transfer rates suggest poor call routing or gaps in agent training.
How to calculate Call Transfer Rate (CTR)
CTR (%)=Total Calls Handled/Number of Calls Transferred×100
Right Party Contact (RPC)
What is it? RPC measures the percentage of outbound calls that successfully connect with the right person.
Why does it matter? Low RPCs can lead to higher operational costs and reduced customer satisfaction. Low RPCs have the potential to be a compliance issue for sales and debt collection call centres.
How to calculate Right Party Contact (RPC)
RPC (%)=Total Number of Contact Attempts/Number of Right Party Contacts×100
UK outbound teams report an average right party contact rate in the low-to-mid 40% range, underlining the importance of data quality and dialling strategy.
Call Abandonment Rate
What is it? Call abandonment rate is the percentage of customer calls that hang up before speaking to an agent.
Why does it matter? High call abandonment signals customer dissatisfaction with wait times.
How to calculate Call Abandonment Rate
Abandonment Rate = (Abandoned Calls/Total Incoming Calls) ×100
The average inbound call abandonment rate currently sits at just over 4%, suggesting most contact centres are managing queues effectively, but with limited margin for error during peak periods.
4. Call centre operations metrics
Metrics that provide insights into the overall efficiency of call centre operations, enabling call centres to optimise processes.
Service Level Agreement (SLA) Compliance
What is it? SLAs measure the percentage of calls answered within a predefined timeframe and quality standard. This is pre-agreed between the call centre and its clients.
Why does it matter? Measuring calls in line with SLAs shows adherence to service-level performance goals.
How to calculate Service Level Agreement compliance
SLA Compliance = (Calls Answered Within SLA Time/Total Incoming Calls) ×100
Cost Per Call (CPC)
What is it? CPC is the average cost incurred per call handled.
Why does it matter? Evaluating CPC helps call centres optimise budget allocation.
How to calculate Cost Per Call (CPC)
CPC = Total Call Centre Costs/Total Calls Handled
For outsourced operations, consistently hitting KPIs such as SLAs, cost per call, and quality scores can be more complex due to working across multiple clients or campaigns concurrently. Our article on call centre outsourcing: how can BPOs meet their KPIs explores how providers can tackle these specific challenges.
Tracking the right metrics is essential for gauging effectiveness, but the follow-up question is always “how do we improve?” For many contact centres, AI and automation are becoming a central part of improving performance.
How AI and automation help contact centres improve metrics
According to the 2025/6 Benchmarking Report:
- 66% of contact centres are already using or piloting AI
- A further 20% planning implementation.
Adoption of AI and automation is becoming widespread, and is reflective of the growing role that technology plays in improving efficiency, quality and customer experience.
A clear use case of AI-powered tools was to reduce metrics such as average handle time to provide a better customer experience.
- 47% of contact centres report improved customer experience following AI adoption
- While 30% say AI has driven a significant transformation in service delivery
These gains directly support improvements in metrics such as first contact resolution, customer satisfaction and customer effort score.
Confidence in these AI and automation tools is high. 99% of contact centre leaders expect AI to improve effectiveness over the next three years, which means that technology advancements will play an increasingly central role in sustaining performance as agent workloads continue to rise.
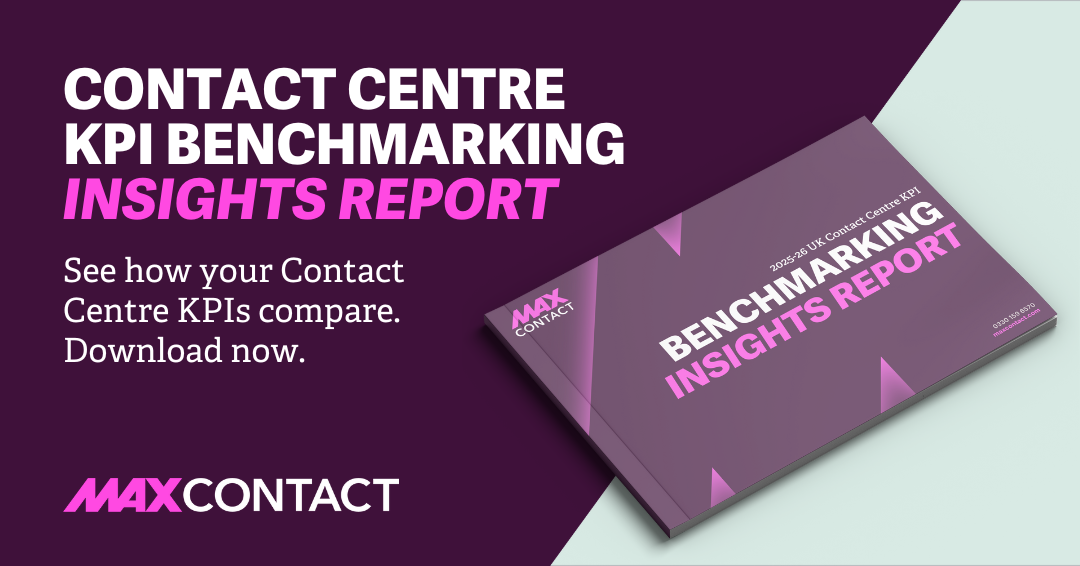
Want to see how your contact centre compares?
Download the 2025/26 UK Contact Centre KPI Benchmarking Report to explore industry averages, performance gaps and emerging trends across customer experience, productivity and operations.

.avif)