As we approach the end of 2024, it’s time to look back at our predictions from last year and reflect on how the contact centre industry has evolved. While some trends played out as expected, others took unexpected turns, and new challenges emerged that shaped the industry’s direction.
AI: From Hype to Reality
We predicted that 2024 would be the year AI moved from the “excitement phase” to the “deployment phase.” This proved largely accurate, though perhaps not in the way many expected. The rush to implement AI solutions in early 2024 revealed important lessons about the technology’s current capabilities and limitations.
The reality check came quickly: while AI showed promise, its productivity improvements landed closer to 25% rather than the marketed 70-80%. Auto-summarisation emerged as the unexpected hero, delivering the most tangible value among AI applications. This taught us an important lesson: sometimes the most valuable AI solutions are the ones that enhance existing processes rather than completely revolutionising them.
Security and Compliance: More Critical Than Ever
Our prediction about security and compliance becoming front and centre proved remarkably accurate. The year saw several significant security incidents that highlighted the vulnerability of customer data, including Transport for London’s widespread system disruption and Ticketmaster’s massive data breach affecting over half a billion customers. These high-profile cases served as sobering reminders of the critical importance of robust security measures.
The SaaS-driven nature of modern contact centres amplified these concerns, as a single breach can now impact entire client networks simultaneously. This catalysed a fundamental shift in how the industry approaches data protection, particularly around AI models and their implementation. The full implementation of Consumer Duty in July 2024 added another layer of complexity, requiring financial services contact centres to demonstrate how they’re promoting fair customer outcomes and increased transparency in every interaction.
The conversation evolved beyond basic compliance checkboxes to encompass deeper ethical considerations about data usage, ownership, and customer profiling. This regulatory evolution, combined with heightened security awareness, has prompted many organisations to reassess their data practices, especially as AI technologies become more deeply embedded in customer service operations.
Hybrid Working: Still a Work in Progress
While we predicted that 2024 would be the year contact centres refined their hybrid working models, the reality showed that this journey is far from complete. With over 60% of contact centres now incorporating home working, the industry continues to grapple with challenges around maintaining company culture, effective onboarding, and managing attrition rates.
Sustainability and CSR: Economic Realities Bite
Our prediction that Environmental, Social and Governance (ESG) and Corporate Social Responsibility (CSR) would take centre stage in 2024 proved to be one of our more challenging forecasts. While we anticipated growing pressure on contact centres to demonstrate their commitment to sustainability and social responsibility, economic headwinds forced many organisations to reprioritise their initiatives.
The tough macroeconomic climate saw sustainability taking a back seat for some contact centres to immediate operational concerns, mirroring broader trends across industries. This shift was evident in the scaling back of net-zero commitments and the reprioritisation of resources toward cost management and operational efficiency.
However, this doesn’t mean sustainability has lost its importance. Rather, organisations have had to become more pragmatic in their approach. Hybrid working, initially championed as a way to reduce carbon footprints, has become more valued for its operational benefits and cost savings. This demonstrates how environmental initiatives can align with business necessities when properly implemented.
Looking back, 2024 taught us that while sustainability remains crucial for long-term success, its implementation needs to be balanced against immediate business survival needs. The challenge going forward will be finding ways to maintain environmental and social commitments while navigating economic pressures.
Customer Experience vs Cost Efficiency: A Delicate Balance
Perhaps our most accurate prediction was about the challenge of reducing costs while improving performance and customer experience. This became the defining challenge of 2024, as inflation and economic pressures forced difficult decisions across the industry.
Throughout the year, we’ve also seen a trend where customer experience initiatives have taken a back seat to cost reduction strategies. The industry’s pivot towards digital deflection, while economically motivated, has sometimes come at the cost of customer satisfaction. This tension between efficiency and experience will likely continue to shape industry decisions going forward into 2025.
Looking Forward
As we end 2024, the contact centre industry stands at a crossroads. The promise of AI remains strong, but with more realistic expectations about its capabilities. The challenge of balancing cost efficiencies with customer experience has never been more acute, and the industry continues to adapt to new working models.
The year has taught us that successful innovation isn’t just about implementing new technology – it’s about understanding our limitations, focusing on tangible value, and maintaining sight of what matters most: delivering quality service to customers while supporting our workforce.
The contact centre industry proved resilient and adaptable in 2024, even if the path forward wasn’t always clear. As we look to 2025, this ability to adapt while maintaining core service values will be more important than ever.
Key Learnings from 2024:
AI implementation requires focused, realistic goals rather than broad transformations.
Security and compliance must be built into every new initiative from the ground up.
Hybrid working isn’t just about technology – it’s about culture and connection.
The balance between cost efficiency and customer experience requires constant attention.
Industry evolution must consider both technological and human factors.
Sustainability initiatives need to demonstrate clear business value alongside environmental benefits.
Economic pressures can reshape priorities, but long-term ESG commitments shouldn’t be abandoned.
As we move into 2025, these lessons will be crucial in shaping the next phase of contact centre evolution. The industry may face continued challenges, but it has shown it has the resilience and creativity to meet them head-on.
Download the UK Contact Centre Regulatory Guide 2025–2027 for a full breakdown of what Ofcom, the ICO, and the FCA now expect from your operation, and what the consequences look like if you get it wrong.
(() => {
const run = () => {
const rich = document.querySelector('#rich-text');
const toc = document.querySelector('#toc');
if (!rich || !toc) return;
const headings = rich.querySelectorAll('h2');
if (!headings.length) {
toc.style.display = 'none';
return;
}
const slugCounts = Object.create(null);
const slugify = (str) => {
const base = (str || '')
.trim()
.toLowerCase()
.normalize('NFD').replace(/[\u0300-\u036f]/g, '')
.replace(/[^a-z0-9\s-]/g, '')
.replace(/\s+/g, '-')
.replace(/-+/g, '-');
const n = (slugCounts[base] = (slugCounts[base] || 0) + 1);
return base ? (n > 1 ? `${base}-${n}` : base) : `section-${n}`;
};
// Build TOC off-DOM
const frag = document.createDocumentFragment();
for (let i = 0; i < headings.length; i++) {
const h = headings[i];
const text = (h.textContent || '').trim() || `Section ${i + 1}`;
if (!h.id) h.id = slugify(text);
const a = document.createElement('a');
a.href = `#${h.id}`;
a.className = 'content_link is-secondary';
a.dataset.target = h.id;
a.setAttribute('aria-label', text);
const p = document.createElement('p');
p.className = 'text-size-small';
p.textContent = text;
a.appendChild(p);
frag.appendChild(a);
}
// Single DOM update
toc.innerHTML = '';
toc.appendChild(frag);
toc.addEventListener('click', (e) => {
const link = e.target.closest('a.content_link[href^="#"]');
if (!link) return;
e.preventDefault();
const id = link.getAttribute('href').slice(1);
const target = document.getElementById(id);
if (!target) return;
// Only compute layout once
const targetTop = target.getBoundingClientRect().top + window.scrollY;
const finalY = targetTop - 150;
window.scrollTo({ top: finalY, behavior: 'smooth' });
history.replaceState(null, '', `#${id}`);
}, { passive: false });
};
// Webflow-safe “run after everything is ready”
if (window.Webflow && Webflow.push) {
Webflow.push(() => requestAnimationFrame(run));
} else {
document.addEventListener('DOMContentLoaded', () => requestAnimationFrame(run));
}
})();
related articles
you might also like
Our articles and industry insights give you expert perspectives, practical strategies, and the latest trends to help your business connect smarter and perform better.
How do consumers actually feel about AI in customer engagement?
As more UK businesses cut contact centre jobs in favour of AI, we asked over 1,000 UK consumers where they actually want automation - and where they still expect a human. The answers aren't as simple as "customers are moving online."
(() => {
const WORDS_PER_MINUTE = 200;
const MULTIPLIER = 1; // your choice
const estimateMinutes = (el) => {
if (!el) return null;
const text = (el.innerText || el.textContent || "").trim();
if (!text) return 1;
const words = (text.match(/\S+/g) || []).length;
const baseMinutes = Math.max(1, Math.ceil(words / WORDS_PER_MINUTE));
return Math.max(1, Math.ceil(baseMinutes * MULTIPLIER));
};
const findNearestTargetInItem = (itemRoot, rt) => {
if (!itemRoot) return null;
return itemRoot.querySelector('.is-text');
};
const applyWithin = (root) => {
// More forgiving selector: attribute present or equals "true"
root.querySelectorAll('[data-rich-text], [data-rich-text="true"]').forEach((rt) => {
const itemRoot =
rt.closest('[role="listitem"]') ||
rt.closest('.w-dyn-item') ||
rt.parentElement ||
root;
const target = findNearestTargetInItem(itemRoot, rt);
if (!target) return;
const mins = estimateMinutes(rt);
if (mins != null) target.textContent = `${mins} MIN READ`;
});
};
const init = () => {
applyWithin(document);
// Re-apply on dynamic changes (pagination/filters)
const mo = new MutationObserver((mutations) => {
for (const m of mutations) {
for (const n of m.addedNodes) {
if (!(n instanceof Element)) continue;
if (
n.matches('[data-rich-text], [data-rich-text="true"], [role="list"], .w-dyn-items, .w-dyn-item') ||
n.querySelector?.('[data-rich-text], [data-rich-text="true"]')
) {
applyWithin(n);
}
}
}
});
mo.observe(document.body, { childList: true, subtree: true });
};
// Robust bootstrapping
if (window.Webflow && Array.isArray(window.Webflow)) {
window.Webflow.push(init);
} else if (document.readyState === 'loading') {
document.addEventListener('DOMContentLoaded', init, { once: true });
} else {
// DOM is already ready; run now
init();
}
})();
A major UK utility provider announced this week that it's cutting 1,300 jobs, leaning harder into AI and digital service. It won't be the last business to make this call, and it's not the first either. Across most industries right now, there's a version of the same bet being placed: that customers are ready to swap people for bots.
Our sales team has had some version of this conversation with almost every customer and prospect this week. The question underneath it is always the same - should we be doing this too?
"It's the question everyone's asking right now," says Richard Langham, VP of Sales at MaxContact. "Listening to your customers is exactly the right instinct. The mistake is assuming what worked for one business, in one industry, applies everywhere else. Consumer behaviour isn't uniform, and neither are the moments that matter to people. Before following someone else's playbook, it's worth checking what your own customers think - not what another sector's did."
We put that question to the public directly. Our Voice of the UK Consumer 2026 report surveyed over 1,000 UK consumers on exactly this: where do you want AI, and where do you want a human? The answers are more specific, and more useful, than "customers are moving online."
Consumers draw a hard line on where AI belongs
We asked people which situations they'd want to keep AI out of entirely. They were clear. Over half (54%) don't want AI anywhere near an emergency. Half say the same for complex account problems. Financial discussions (49%) and negotiating terms (46%) aren't far behind.
Flip the question and ask where a human matters most, and you get the same answer from the other direction: emergencies top the list at 41%, then complex account queries (33%), financial discussions (29%), and explaining something personal or sensitive (26%).
These situations are more common than they might sound. A missed bill. A bereavement. A boiler packing in over winter. Someone explaining a difficult situation to a company for the first time. Contact centres deal with moments like these every single day - and our data says people want a person on the other end when it happens.
AI has its place
There's real appetite for automation where it's genuinely useful: answering FAQs, routing calls, pulling up account updates. People are happy to let a bot handle the boring stuff.
There's even one situation where AI wins outright: talking to a lender about financial difficulty. More people choose AI here than a human agent. But when you dig into why, it's not enthusiasm for the technology - it's privacy. People find it easier to admit they're struggling to a screen than to a person. That's not proof consumers prefer bots. It's proof they want to avoid judgement.
Listen to your own customers, not someone else's headline
"A telecoms customer, an insurance customer and an energy customer don't necessarily feel the same way about AI," Langham says. "What one industry can get away with, another can't. What worked for one company's customer base might land completely differently with yours."
Here's what to get right before making any move on the back of someone else's numbers:
Check your own data before borrowing someone else's conclusion - a drop in call volume tells you what stopped happening, not why, and not whether it's safe to read as "customers don't want people anymore."
Keep the human path open exactly where our data says it counts - emergencies, complex issues, money problems, anything personal. These are the situations where AI is least welcome, and where getting it wrong does the most damage to trust.
Tell people when they're talking to AI - 88% of consumers say this matters, half calling it very important. If AI is handling more of your first-line contact, being upfront about it isn't optional. It's what keeps trust intact.
Moving contact online doesn't close the trust gap on its own. Keeping a human reachable for the moments people care about most does, and knowing which moments those are for your customers - not someone else's - is the bit worth getting right.
If you're weighing up a similar decision, don't do it on assumptions borrowed from a headline. Get the full picture - including sector-by-sector breakdowns for utilities, telecoms, finance/debt and insurance - in our Voice of the UK Consumer 2026 report.Download here.
Blog
5 min read
What Good Contact Centre Performance Looks Like… and Why Most Fall Short
Most contact centres are measuring the right things. But often, they're drawing the wrong conclusions from the data.
(() => {
const WORDS_PER_MINUTE = 200;
const MULTIPLIER = 1; // your choice
const estimateMinutes = (el) => {
if (!el) return null;
const text = (el.innerText || el.textContent || "").trim();
if (!text) return 1;
const words = (text.match(/\S+/g) || []).length;
const baseMinutes = Math.max(1, Math.ceil(words / WORDS_PER_MINUTE));
return Math.max(1, Math.ceil(baseMinutes * MULTIPLIER));
};
const findNearestTargetInItem = (itemRoot, rt) => {
if (!itemRoot) return null;
return itemRoot.querySelector('.is-text');
};
const applyWithin = (root) => {
// More forgiving selector: attribute present or equals "true"
root.querySelectorAll('[data-rich-text], [data-rich-text="true"]').forEach((rt) => {
const itemRoot =
rt.closest('[role="listitem"]') ||
rt.closest('.w-dyn-item') ||
rt.parentElement ||
root;
const target = findNearestTargetInItem(itemRoot, rt);
if (!target) return;
const mins = estimateMinutes(rt);
if (mins != null) target.textContent = `${mins} MIN READ`;
});
};
const init = () => {
applyWithin(document);
// Re-apply on dynamic changes (pagination/filters)
const mo = new MutationObserver((mutations) => {
for (const m of mutations) {
for (const n of m.addedNodes) {
if (!(n instanceof Element)) continue;
if (
n.matches('[data-rich-text], [data-rich-text="true"], [role="list"], .w-dyn-items, .w-dyn-item') ||
n.querySelector?.('[data-rich-text], [data-rich-text="true"]')
) {
applyWithin(n);
}
}
}
});
mo.observe(document.body, { childList: true, subtree: true });
};
// Robust bootstrapping
if (window.Webflow && Array.isArray(window.Webflow)) {
window.Webflow.push(init);
} else if (document.readyState === 'loading') {
document.addEventListener('DOMContentLoaded', init, { once: true });
} else {
// DOM is already ready; run now
init();
}
})();
Tracking KPIs quarter-on-quarter tells you whether you're improving. It doesn't tell you whether the number you're improving towards is actually good. And it doesn't tell you whether your measurement is giving you an accurate picture of your operation in the first place.
That last point is where the real performance gap comes from.
Two thirds of UK contact centres are now using or piloting AI, with 99% of those operations feeling confident in its impact. Yet across the metrics that matter most, performance has barely shifted year-on-year. FCR is flat or declining. Conversion rates are down. AHT is unchanged. Agent workloads are up 10%. The sector has invested heavily in technology but the performance gap remains as wide as ever.
The reason isn't that AI doesn't work. It's that most organisations use it in response to visible symptoms such as reducing call volume or speeding up response times, which leaves poor performance problems unaddressed at the root cause.
To understand where that gap sits, MaxContact surveyed 300 UK contact centre decision makers across sales, customer service and debt collection for our 2025-26 KPI Benchmarking Insights Report. It's the second year we've run the research, so we can track how performance is shifting over time.
The measurement problem nobody's talking about
Before we get to the performance benchmarks, let's draw your attention to the issue that runs through all of them.
Most contact centres measure performance through post-call surveys, manual QA sampling and periodic reporting. Post-call surveys capture a small sample of interactions, skewed toward customers at the extremes of satisfaction. Manual QA in organisations we speak to reaches max 5% of calls. Periodic reporting tells you what happened last month.
At that sample rate, you can identify which metric is underperforming but you can't reliably identify why. And if you can't identify why, you can't fix it. You're just guessing, which is what most performance optimisations actually are, dressed up as data-driven decision making.
This matters because every benchmark in this piece is only useful if your measurement is telling you the truth. A CSAT score built on 10% of calls, an FCR rate from manually sampled interactions, a conversion rate that looks reasonable against a sector average you've never questioned. These numbers can give you false confidence about performance you haven't really achieved.
If you want to review how your operation is capturing performance data, our complete guide to call centre reporting metrics covers the full picture. Keep that in mind as we work through each benchmark.
CSAT: the conditions matter more than the score
48% of contact centre leaders rank CSAT as a top 5 KPI
CSAT is the metric most contact centre leaders care about most. It's also the one where the gap between stated priority and operational reality is widest.
There's no single sector mean for CSAT in our data. Satisfaction scores vary too much by sector, use case and measurement method to produce a meaningful average. That variability is the first signal that something's wrong with how most operations approach it.
The more useful question isn't "what's a good CSAT score." It's "what conditions in your operation are producing the score you have." And on that measure, the benchmark data reveals a problem most operations aren't looking at directly.
Agent workloads increased at 53% of contact centres last year, a 10% rise on the year before. Annual agent turnover sits at 31.2% on average, with some operations reporting churn of 41-50%. These metrics are the direct mechanism through which CSAT deteriorates. Stretched agents handle calls differently, and high turnover means less experienced people managing more complex conversations. Neither produces the kind of consistent interactions that drive strong satisfaction scores.
Only 10% of contact centres in our survey reported annual churn below 20%. Those operations aren't just performing better on a staffing metric. They're building the kind of service consistency that CSAT is actually measuring. For most, high turnover is a structural drag on service quality that no post-call survey will fix. The survey measures the symptom. The cause goes unaddressed.
What good looks like also depends on your use case. In outbound sales, CSAT is partly a lead quality and script problem. Customers who feel mismatched to a product will score you poorly regardless of how the agent handled the call. In inbound customer service, resolution and wait time are the key drivers. The levers are different, so the benchmarks should be treated differently too.
The contact centres with the strongest CSAT scores aren't waiting for survey results to tell them something's wrong. They're using Conversation Analytics to understand sentiment across 100% of calls, spotting where calls are going wrong before it shows up in a survey score and before the customer has already decided not to come back.
Speed of answer: you're prioritising a metric you're not hitting
Sector mean: 17.4 seconds. High performer target: under 10 seconds
Speed of answer is the second most prioritised KPI in our survey, with 35% of respondents ranking it in their top five. The benchmark data reveals something uncomfortable about it.
Across all contact centres, the mean is 17.4 seconds. The high performer target is 10 seconds. Nearly 40% of respondents are already hitting between 2 and 10 seconds. That's the bracket that defines good. Therefore, most contact centres are actively prioritising a metric they're not hitting, against a standard they may not have explicitly set.
The difference between 17 seconds and 10 seconds may not sound critical. But for a customer who has already decided to pick up the phone, who has exhausted self-service and committed to the friction of a call, every additional second in a queue adds to existing frustration. Our data shows mean call abandonment sits at 4.1%. Operations answering in under 10 seconds are less exposed to that abandonment, and the customers they do lose are disproportionately the ones closest to walking away entirely.
Speed of answer is primarily an inbound metric. For outbound sales and debt collection, the equivalent is connect rate, the percentage of dialled numbers that reach a person. The sector mean is 42.8%, with high performers achieving 60-79%. If your operation is outbound-led, that's the speed benchmark driving your performance.
For inbound teams, closing the gap between 17 and 10 seconds comes down to workforce management and call deflection. Smarter IVR design, AI-assisted resolution of routine queries, and capacity planning that reflects actual demand patterns. Our report shows 38% of respondents are already using predictive analytics for capacity planning. Those operations hold speed of answer during demand spikes without the cost of permanent overstaffing.
Service level achievement: a baseline, not a definition of good
34% of contact centre leaders rank service level achievement as a top 5 KPI
Service level achievement sits third in our KPI rankings. It's also the metric where the definition of good is most taken for granted.
The standard most operations work to is the 80/20 rule: 80% of calls answered within 20 seconds. It's been around long enough to feel like a law of physics rather than a performance target. Most contact centres treat hitting it as the definition of good when it isn't. It's the definition of acceptable.
The operations genuinely performing well on service level aren't managing to 80/20. They're using it as a floor. The 39% of respondents answering calls within 2-10 seconds haven't set a different target. They've built operations that outperform the standard because their workforce management, demand forecasting and deflection are sophisticated enough to absorb volume spikes without queue times creeping up.
The biggest threat to service level is workload. Agent workloads increased at 53% of contact centres last year. When demand rises faster than capacity, service level is the first metric to suffer and the one customers feel most directly. You can have strong FCR and solid CSAT and still lose customers at the queue stage because they simply couldn't get through.
For outbound operations, service level works differently. It's less about queue management and more about campaign pacing, maintaining consistent contact rates without burning through call lists or hitting compliance thresholds. Good performance in any channel means holding your numbers when conditions get difficult, not just when demand is manageable.
The 38% of respondents using predictive analytics for capacity planning are better placed here than those still forecasting from historical averages. Demand patterns have shifted, and operations working from last year's data are likely to be caught short. Service level is where that shows up first.
80/20 is where you start. Consistently beating it is what good actually looks like.
Most contact centres trying to improve conversion rate start in the wrong place. They review scripts. They add coaching. They push agents to make more calls. The data suggests none of those things address the primary problem.
The sector mean conversion rate is 16%. Average daily calls per agent have fallen from 65.5 to 59 year-on-year. First-call close rates have dropped from 28% to 25%. That looks like a performance decline. But consumer confidence has fallen sharply over the same period. Agents aren't getting worse. They're working harder against a more resistant environment. Pushing them to make more calls doesn't close the gap. It increases attrition.
The operations holding conversion rates above 20% are doing it by being more precise about when they call, who they call, and which dialling mode they use for which campaign type. Most operations run one dialling mode across all campaign types and wonder why conversion is flat.
To show how wide that gap can be: across 7.8 million calls on the MaxContact platform, our customers achieve a 38.8% success rate against a sector mean of 16%. That difference doesn't come from better agents. It comes from smarter contact strategies. Predictive dialling for high-volume campaigns, preview dialling for high-value or sensitive conversations, and call timing built around when a specific customer is likely to answer.
For debt collection, the benchmarks shift but the underlying point holds. Promise to pay rate sits at a sector mean of 28%, and good is above 30%. Right party contact averages 27%. FCR in debt collection has dropped five percentage points to 37%, reflecting economic pressure on consumers rather than operational failure. But 15% of debt collection operations are still hitting collection rates of 40-49% in those same conditions. Reaching the right person at the right moment with an agent trained for a sensitive financial conversation produces a fundamentally different result than high-volume dialling and hoping for the best, and the operations hitting those numbers know it.
If your conversion rate is below the sector mean, the most useful question isn't "how do we improve our scripts." It's "are we contacting the right people, at the right time, in the right way" and do we have the data to answer that honestly.
FCR and AHT: the metric relationship that determines everything else
Inbound FCR mean: 40.9%. High performer bracket: 50-79%. Mean AHT: 7.8 minutes
FCR and AHT are the two metrics most likely to be misread in isolation and most likely to be managed against each other in ways that make both worse.
The pattern is familiar. Leadership sees AHT creeping up and pushes agents to handle calls faster. AHT comes down. FCR comes down with it, because customers whose issues weren't properly resolved call back. Cost per contact rises. CSAT drops. The operation has optimised for a number and degraded its actual performance in the process.
The metric that looked like it was improving was masking a problem getting worse. This is why FCR and AHT need to be read together, always.
The inbound FCR mean is 40.9%. High performers, the top 27% of respondents, achieve 50-79%. That's the bracket to aim for. Mean inbound AHT is 7.8 minutes, with over a third of respondents reporting 10-15 minutes. That higher figure isn't a problem in isolation. A 12-minute call that resolves the issue completely is a better outcome for the customer, the agent and the cost base than a 5-minute call that generates a callback.
Good isn't a low AHT. It's a high FCR with an AHT that reflects the complexity of what your operation actually handles.
The use case split matters here. In inbound customer service, FCR above 50% is the high performer threshold. The operations hitting it aren't rushing calls. They're doing it through better agent knowledge, faster access to customer history, and calls that get to the point without losing the quality of the resolution. In debt collection, FCR has dropped five percentage points year-on-year to 37%, reflecting economic pressure on consumers. The 15% of debt collection operations achieving 40-49% FCR in those conditions are differentiating on contact precision and conversation quality, not volume. For outbound sales, the paired benchmarks that matter are calls to success ratio, with a mean of 15.6 calls per sale, and handle time, where 4-5 minutes is the sweet spot.
The performance gap on FCR is also where the measurement problem bites hardest. Most operations run manual QA on 2-5% of calls. At that sample rate, you can identify that FCR is low but you can't reliably identify why, which means you can't fix it systematically. Is it a knowledge gap? A script failure? A specific objection type agents aren't equipped to handle? A process breakdown adding unnecessary handle time without improving resolution? You can't answer those questions from 2-5% of your call data.
If AHT is the metric you're most focused on right now, our guide to reducing average handle time without sacrificing customer experience covers the specific tactics for closing that gap without pushing FCR in the wrong direction.
Why the performance gap isn't closing
Two-thirds of UK contact centres are using or piloting AI, and sentiment is overwhelmingly positive. So why haven't the numbers moved?
The answer is in where the investment is going. Chatbots and virtual agents are the most common AI applications in our survey, at 57% and 56% respectively. Both are built to stop calls reaching agents in the first place. That's a legitimate goal. But deflection doesn't tell you anything about the conversations that do get through. It can't explain why your FCR is sitting at 40% when high performers are hitting 60%. It won't surface the objection that keeps killing conversions at the same point in the call. It has no view on where resolution breaks down, or why.
The contact centres with the strongest metrics aren't necessarily running more AI tools. They're running them in a different place. Conversation Analytics applied across 100% of calls gives you a fundamentally different picture than manual QA on 2-5%. You can see patterns. You can identify what high-performing agents are doing differently. You can stop guessing at why a metric is underperforming and start knowing. Most contact centres already have the technology to do this. The question is whether it's being pointed at the right thing.
Where does your contact centre performance sit?
These benchmarks aren't a verdict. An FCR of 38% or a conversion rate below the sector mean doesn't mean your operation is in trouble, it means you now have a clearer sense of where the gap is and roughly how wide it is. Most operations never get that far.
The contact centres pulling ahead aren't doing anything the average operation couldn't. Agent stability is managed deliberately rather than accepted as an inevitability. Dialling strategy is matched to campaign type. FCR and AHT are read together. And critically, performance decisions are based on what's happening across the full call volume, not the fraction that manual QA and post-call surveys ever reach.
That last point is what makes underperformance so persistent. If your measurement is only capturing part of what's happening, you're optimising against an incomplete picture. The benchmarks in this report are only useful if the data behind your own metrics is sound.
For a broader look at efficiency measurement across your operation, our guide to measuring call centre efficiency is worth a read.
Want to go deeper on the data? The full 2025-26 UK Contact Centre KPI Benchmarking Insights Report covers all 300 respondents, segmented by use case, with year-on-year comparisons across every metric in this piece.
(() => {
const WORDS_PER_MINUTE = 200;
const MULTIPLIER = 1; // your choice
const estimateMinutes = (el) => {
if (!el) return null;
const text = (el.innerText || el.textContent || "").trim();
if (!text) return 1;
const words = (text.match(/\S+/g) || []).length;
const baseMinutes = Math.max(1, Math.ceil(words / WORDS_PER_MINUTE));
return Math.max(1, Math.ceil(baseMinutes * MULTIPLIER));
};
const findNearestTargetInItem = (itemRoot, rt) => {
if (!itemRoot) return null;
return itemRoot.querySelector('.is-text');
};
const applyWithin = (root) => {
// More forgiving selector: attribute present or equals "true"
root.querySelectorAll('[data-rich-text], [data-rich-text="true"]').forEach((rt) => {
const itemRoot =
rt.closest('[role="listitem"]') ||
rt.closest('.w-dyn-item') ||
rt.parentElement ||
root;
const target = findNearestTargetInItem(itemRoot, rt);
if (!target) return;
const mins = estimateMinutes(rt);
if (mins != null) target.textContent = `${mins} MIN READ`;
});
};
const init = () => {
applyWithin(document);
// Re-apply on dynamic changes (pagination/filters)
const mo = new MutationObserver((mutations) => {
for (const m of mutations) {
for (const n of m.addedNodes) {
if (!(n instanceof Element)) continue;
if (
n.matches('[data-rich-text], [data-rich-text="true"], [role="list"], .w-dyn-items, .w-dyn-item') ||
n.querySelector?.('[data-rich-text], [data-rich-text="true"]')
) {
applyWithin(n);
}
}
}
});
mo.observe(document.body, { childList: true, subtree: true });
};
// Robust bootstrapping
if (window.Webflow && Array.isArray(window.Webflow)) {
window.Webflow.push(init);
} else if (document.readyState === 'loading') {
document.addEventListener('DOMContentLoaded', init, { once: true });
} else {
// DOM is already ready; run now
init();
}
})();
Quality assurance in a call centre is the process of monitoring, evaluating, and improving agent interactions to ensure consistent customer experience and performance standards. All contact centres have a QA process. But most struggle to drive change from the data it provides.
For years, manual QA was the only option, and for many contact centres it still is. Supervisors sample a handful of calls, score them against a checklist and then file the results. Roughly 5% of interactions get reviewed on average. And then any feedback is given to agents days later (if at all).
It was never a great system. But as interaction volumes rise, agent workloads increase, and 42% of customers say they'll switch providers after a single poor experience, the cost of that insight-to-action gap is getting harder to absorb.
This guide covers how to make the shift from using QA as a monitoring exercise to using it as a driver of performance with AI-powered QA software.
You're monitoring quality. But are you actually improving it?
Knowing how to improve quality assurance in a call centre starts with an honest question: is your QA process actually producing change, or just producing data?
Traditional QA has a lag problem built in. A call happens and a supervisor reviews it days later. Feedback reaches the agent at a point where they've had dozens of conversations since the one that’s been reviewed. The connection between the behaviour and the coaching is weak, and the window for meaningful learning has already closed.
There's also the sampling issue. Manual QA typically covers around 5% of interactions.
“Leaders want answers, but those answers sit behind small QA samples, anecdotal feedback, and performance dashboards that only tell part of the story.” Connor Bowler, Principal Product Manager at MaxContact
The result is stark: manual QA gives you a story about some of your calls while an AI-powered platform gives you the truth about all of them.
Stop treating QA as an audit. Start treating it as a coaching tool.
Improving quality assurance starts with how you think about the QA function. It’s not an audit, but rather a coaching engine.
Approach QA with an audit mindset, and you’ll get reports. Approach QA with a coaching mindset, and you’ll get improvement. Contact centres that use QA to drive real behaviour change tend to do three things differently:
What They Do
Why It Works
Close the feedback loop fast
Feedback delivered within 24 hours lands harder. Agents have context, they remember the call, and the learning is concrete rather than abstract.
Make QA data visible to agents, not managers only
When agents can see their own scores and track their own trends, QA becomes something they're engaged with rather than something that's done to them. That ownership is where improvement starts.
Coach patterns, not just incidents
A single low-scoring call is an incident. Five with the same failure point is a pattern. Coaching patterns is where QA data creates lasting change.
As AI handles monitoring and scoring at scale, QA teams move away from manual call reviews and closer to coaching, analysis, and performance design; a more valuable role, and a more sustainable one.
It's a shift some organisations are already making.
The ICX Use Case
ICX, a customer engagement provider for brands including Nissan, Suzuki, and Stellantis, replaced manual call reviews with MaxContact's Conversation Analytics platform. Quality assessors moved from repeated audio replays to transcript-based reviews, with AI-powered search surfacing compliance issues, objection patterns, and coaching opportunities across every interaction. Training is now built directly from sentiment and objection data, feeding into one-to-ones and agent development.
Call centre quality assurance metrics: What they're actually telling you
Once you've made the shift from audit to coaching mindset, the next question is: what is your QA data actually telling you?
The most common scorecard measures script adherence, handling time, first call resolution, CSAT, and compliance markers. All of these are valid, but they can mislead if you're drawing conclusions from a 5% sample. The same metrics applied across 100% of interactions tell a very different story.
A few principles that make QA data more actionable:
1. Work out whether you've got a data problem or a coaching problem.
An agent who consistently mis-dispositions calls might not need coaching, they might need better data or a clearer process. An agent whose sentiment scores drop in the last hour of every shift has a different problem entirely. QA data is most valuable when it helps you tell the difference.
2. Don't look at scores in isolation. Connect them to outcomes instead.
A call that scores well on process but ends in a complaint tells you the agent followed the script and still got it wrong. Map your QA scores against CSAT, NPS, or complaint rates to find out which quality indicators actually predict good outcomes and which ones are just measuring process-following.
3. Track how quickly agents improve after coaching.
The rate of improvement following a coaching session is more useful than the score itself. If coaching isn't producing measurable change within a defined window, perhaps it’s the approach that needs to change, not just the agent's behaviour.
4. Use sentiment data to find what scores can't show you.
Scores tell you what happened procedurally. Sentiment analysis tells you how the customer felt at the start of the call, at the point of objection, and at sign-off. The gap between a high compliance score and a negative end sentiment is often where the most valuable coaching insight sits.
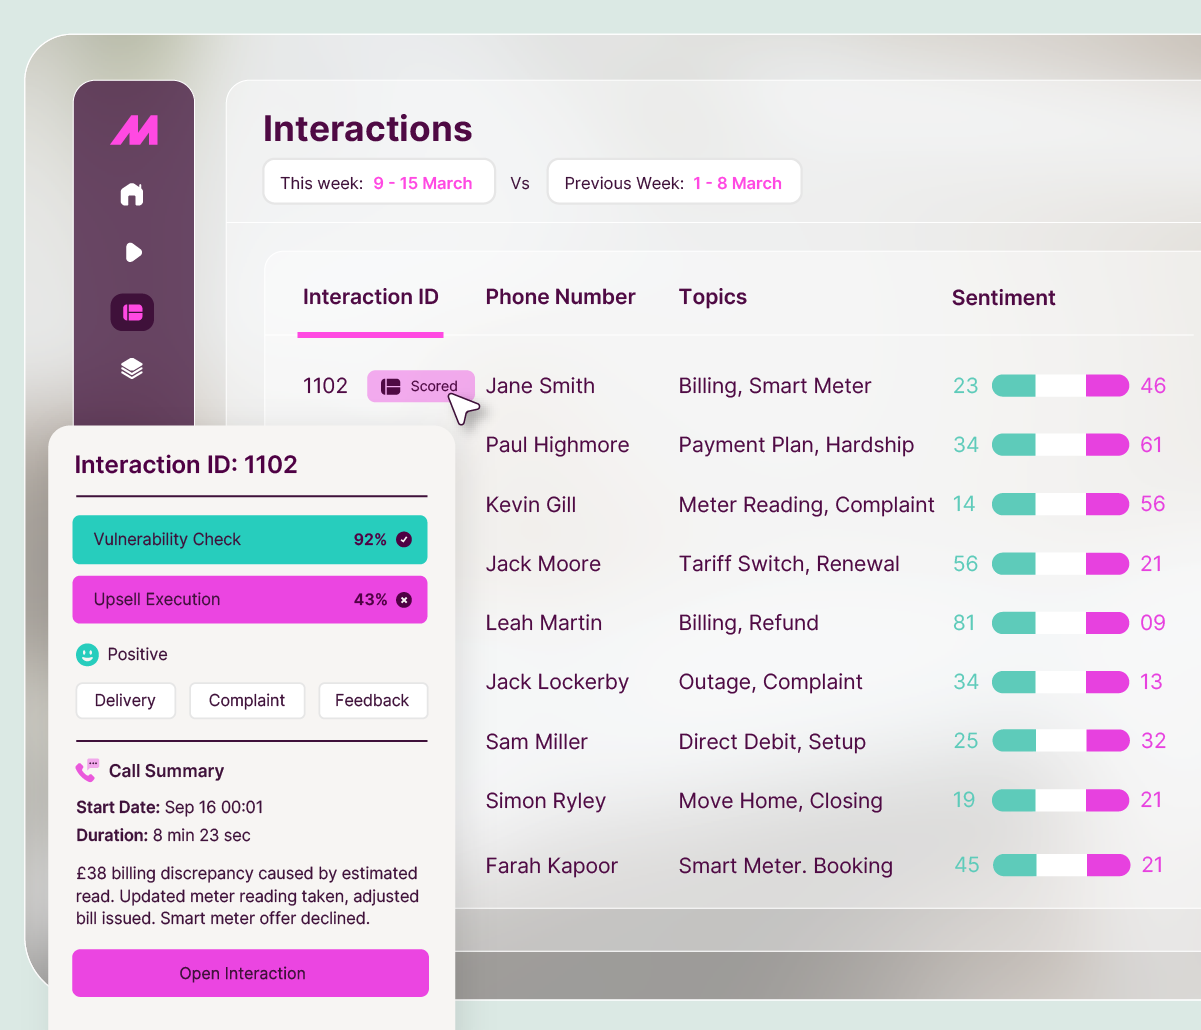
MaxContact's Auto QA applies customisable scorecards consistently across every selected interaction, including auto-fail criteria for non-negotiable standards, and surfaces sentiment alongside compliance scoring in a single view. QA managers spend less time manually reviewing calls and more time acting on what the data reveals.
Auto QA Score Card
The difference between feedback that lands and feedback that doesn't
Call centre quality monitoring best practices all point to the same conclusion: data doesn't change behaviour. Coaching does.
Specific beats general, every time. "You need to listen more actively" isn't actionable. "On this call at 2:34, the customer mentioned they'd been waiting three weeks and you moved on without acknowledging it. Here's what it sounds like when it's handled well" is constructive, actionable feedback. .
Frequency matters more than depth. Regular short coaching sessions (ten minutes a week focused on one call or one skill) tend to produce better outcomes than monthly deep-dives. Behaviour change is cumulative.
Self-review builds ownership. Agents who listen back to their own calls and score themselves before a coaching session arrive with more self-awareness and more investment in the gaps. The manager is coaching, not judging.
Use your best calls as teaching tools. Sharing anonymised examples of top-performing interactions gives the whole team a concrete standard to aim for. Not a number. A behaviour.
Data from MaxContact's Conversation Analytics platform drawn from over 700,000 objections across a six-month period, shows agents successfully overcome just 39% of objections, while 61% remain unresolved. The most challenging category is need objections ("not interested", "no immediate need"), which represent 46% of all objections but carry the lowest conversion rate. That's a pattern, and it needs a pattern-level response.
For BPOs like ICX, managing quality assurance across multiple client accounts at scale, running separate manual processes for each campaign simply isn't viable. "Anything that helps us connect to more of the conversations, especially given the volume we handle, is incredibly valuable. The team does a fantastic job, but no one can review everything manually. With Conversation Analytics, we can proactively support our agents and maintain complete oversight, so we never miss a critical moment or insight," said Sarah Franks, Call Centre Manager at ICX.
The hidden reason your QA findings never make it to the coaching conversation
There's a practical barrier between QA insight and coaching action that doesn't get talked about enough: post-call admin.
After every interaction, agents log outcomes, complete call notes, update CRM records, and prepare for the next contact. In high-volume environments, where over 52% of contact centre leaders report agent workloads have increased year-on-year, that wrap-up time absorbs the space that could go into engaging with coaching materials or reviewing their own performance data.
When agents are constantly catching up on admin, QA becomes something that happens to them in scheduled sessions, not something they engage with actively. The feedback loop gets longer. The shift from "QA as audit" to "QA as improvement" stalls.
Agent Wrap-Up Summary changes this directly. By automatically capturing call summaries, key outcomes, sentiment, topics, and follow-up actions at the point of wrap, it creates a consistent record for every interaction without adding work for the agent. That frees up the time and headspace to engage with performance data in real time.
What better QA actually means for your bottom line
For contact centre leaders asking how to improve quality scores in their call centre, the answer comes down to this: quality improvement has to show up in numbers the business cares about.
For BPOs, that means client retention. Clients expect their customers to be handled to a defined standard; when quality slips, renewals are at risk. With agent attrition running at 31% across the industry, AI-powered QA becomes even more valuable. New agents can be held to the same standard from day one, without relying on institutional knowledge that walks out the door.
For financial services and insurance contact centres, the case is just as direct. Agents who handle complaints well, identify vulnerability accurately, and resolve queries first time produce better CSAT, fewer escalations, and stronger retention. With first call resolution rates dropping from 43% to 37% year-on-year, the contact centres that reverse that trend through better coaching protect both customer relationships and commercial performance.
Either way, QA only delivers value if it produces measurable change, closing the loop between monitoring, coaching, and results, consistently and at pace.
How to make all of this work when you're dealing with real call volumes
The barrier has always been operational: the volume of calls, the limits of manual review, and the admin overhead that eats into coaching time.
The contact centres that improve quality consistently aren't doing something fundamentally different. They've just stopped treating QA as something that happens after the call and started building it into how the operation runs; faster feedback, visible data, coaching that's based on patterns rather than incidents.
At the volumes most contact centres are dealing with, that only works if the infrastructure supports it. AI-powered QA removes the manual overhead that makes it impractical, covering every interaction, surfacing what matters, and giving agents and managers the time to actually act on what the data shows.
If your QA process is still generating reports instead of results, it's time to change how it works. See how MaxContact's Auto QA and Agent Wrap-Up Summary turn insight into action.
.avif)